Lesson 1 of 123:553 Sources
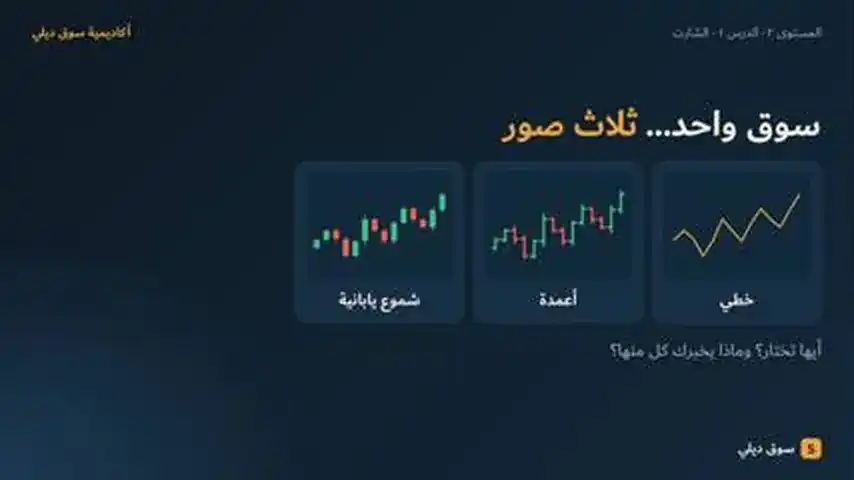
Charts: line, bar and Japanese candlesticks
Recorded. Publishing soon
Educational content, not investment advice. Nour explains how markets work. She never tells you what to buy or sell.
Technical analysis studies price movement itself, and the chart is its first tool. Platforms such as MetaTrader 5 show price as a line, bars or Japanese candlesticks.
- A line chart connects closing prices only: great for the big picture, but it hides what happened inside each period.
- Bars and candlesticks show four prices per period: open, high, low and close.
- A candle has a body (open to close) and wicks (high and low); its colour tells you whether it closed above or below its open.
- One candle describes the past. It does not promise the future.
Quick check
Three questions. Pick an answer to see why.
1.What does a line chart show?
2.In a candlestick, what does the body show?
3.A stock opens at 100, trades between 98 and 106, and closes at 104. The candle is:
Sources
Every fact in this lesson is backed by the sources below.
- 1.MetaTrader 5 Help — View and configure chartsCharts can be shown as bars, Japanese candlesticks or a line
- 2.CME Group Education — Chart types: candlestick, line, barLine chart shows closing prices; bars and candles show open, high, low and close; body and wick definitions
- 3.ASX — Shares course 11: Technical analysis (PDF)A line chart represents only one point per period; charts cannot predict the future with any certainty
Educational content, not investment advice. Risk warning: trading forex, CFDs, gold and crypto carries a high level of risk and may not be suitable for everyone. You can lose more than you put in. Souq Daily is an education platform. Nothing here is investment advice, a recommendation or an offer, and past performance does not predict future results.