Lección 1 de 123:553 Fuentes
Gráficos: línea, barras y velas japonesas
Grabado. Se publica pronto
Contenido educativo, no asesoramiento de inversión. Nour explica cómo funcionan los mercados. Nunca te dice qué comprar o vender.
La traducción completa de esta lección llegará pronto. Estás leyendo la versión en inglés.
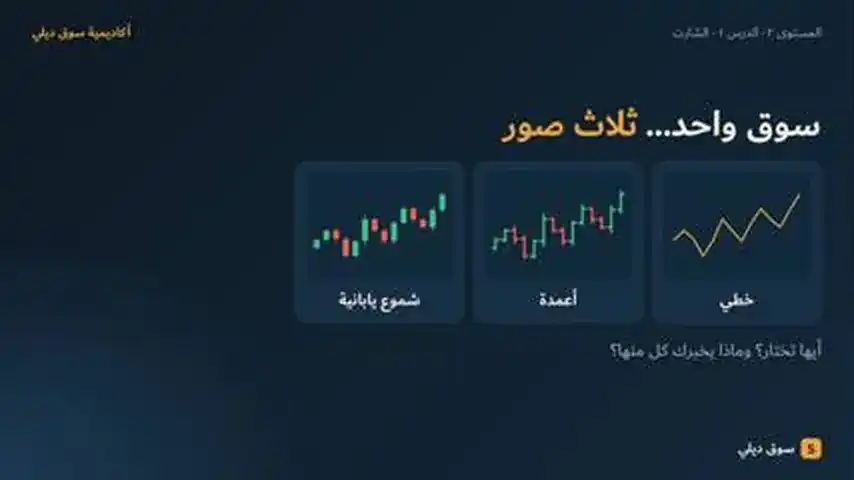
Technical analysis studies price movement itself, and the chart is its first tool. Platforms such as MetaTrader 5 show price as a line, bars or Japanese candlesticks.
- A line chart connects closing prices only: great for the big picture, but it hides what happened inside each period.
- Bars and candlesticks show four prices per period: open, high, low and close.
- A candle has a body (open to close) and wicks (high and low); its colour tells you whether it closed above or below its open.
- One candle describes the past. It does not promise the future.
Comprobación rápida
Tres preguntas. Elige una respuesta para ver el porqué.
1.What does a line chart show?
2.In a candlestick, what does the body show?
3.A stock opens at 100, trades between 98 and 106, and closes at 104. The candle is:
Fuentes
Cada dato de esta lección está respaldado por las fuentes de abajo.
- 1.MetaTrader 5 Help — View and configure chartsCharts can be shown as bars, Japanese candlesticks or a line
- 2.CME Group Education — Chart types: candlestick, line, barLine chart shows closing prices; bars and candles show open, high, low and close; body and wick definitions
- 3.ASX — Shares course 11: Technical analysis (PDF)A line chart represents only one point per period; charts cannot predict the future with any certainty
Contenido educativo, no asesoramiento de inversión. Advertencia de riesgo: operar con forex, CFD, oro y cripto conlleva un riesgo elevado y puede no ser adecuado para todos. Puedes perder más de lo que inviertes. Souq Daily es una plataforma educativa. Nada de lo que hay aquí es asesoramiento de inversión, una recomendación ni una oferta, y los resultados pasados no anticipan resultados futuros.