Pelajaran 1 dari 123:553 Sumber
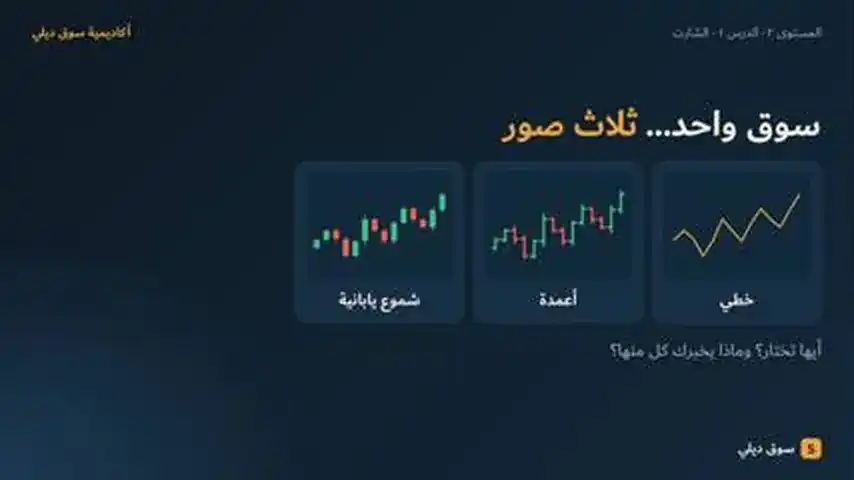
Grafik: garis, batang, dan candlestick Jepang
Sudah direkam, segera tayang
Konten edukasi, bukan saran investasi. Nour menjelaskan cara kerja pasar. Ia tidak pernah menyuruhmu membeli atau menjual apa pun.
Terjemahan lengkap pelajaran ini segera hadir. Kamu sedang membaca versi bahasa Inggris.
Technical analysis studies price movement itself, and the chart is its first tool. Platforms such as MetaTrader 5 show price as a line, bars or Japanese candlesticks.
- A line chart connects closing prices only: great for the big picture, but it hides what happened inside each period.
- Bars and candlesticks show four prices per period: open, high, low and close.
- A candle has a body (open to close) and wicks (high and low); its colour tells you whether it closed above or below its open.
- One candle describes the past. It does not promise the future.
Cek cepat
Tiga soal. Pilih jawaban untuk melihat alasannya.
1.What does a line chart show?
2.In a candlestick, what does the body show?
3.A stock opens at 100, trades between 98 and 106, and closes at 104. The candle is:
Sumber
Setiap fakta dalam pelajaran ini didukung oleh sumber di bawah.
- 1.MetaTrader 5 Help — View and configure chartsCharts can be shown as bars, Japanese candlesticks or a line
- 2.CME Group Education — Chart types: candlestick, line, barLine chart shows closing prices; bars and candles show open, high, low and close; body and wick definitions
- 3.ASX — Shares course 11: Technical analysis (PDF)A line chart represents only one point per period; charts cannot predict the future with any certainty
Konten edukasi, bukan saran investasi. Peringatan risiko: trading forex, CFD, emas, dan kripto memiliki risiko tinggi dan mungkin tidak cocok untuk semua orang. Kamu bisa kehilangan lebih dari dana yang kamu setorkan. Souq Daily adalah platform edukasi. Tidak ada isi di sini yang merupakan saran investasi, rekomendasi, atau penawaran, dan kinerja masa lalu tidak menjamin hasil di masa depan.