12강 중 1강3:553 출처
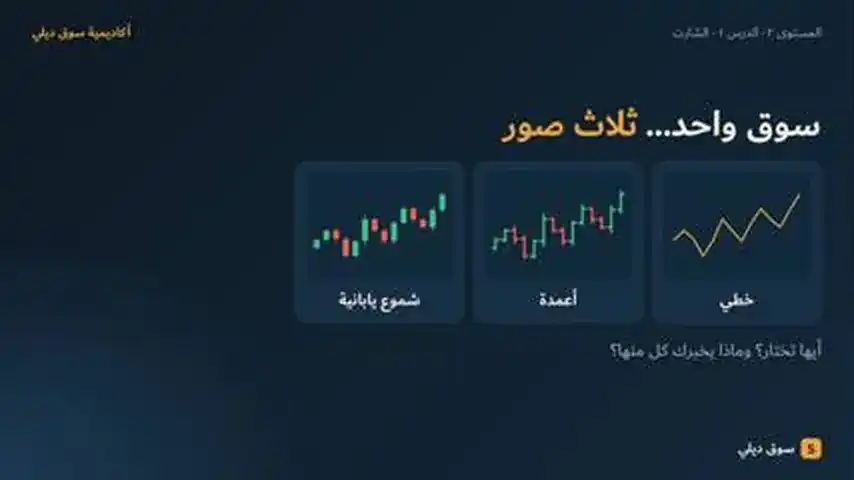
차트: 선, 바, 캔들
녹화 완료, 곧 공개
진행: Nour아랍어 진행, 자막 제공. 다른 언어도 준비 중입니다.
교육 콘텐츠이며 투자 조언이 아닙니다. Nour는 시장의 원리를 설명할 뿐, 무엇을 사거나 팔라고 말하지 않습니다.
이 강의의 한국어 전체 번역은 곧 제공됩니다. 지금은 영어판을 보고 계십니다.
Technical analysis studies price movement itself, and the chart is its first tool. Platforms such as MetaTrader 5 show price as a line, bars or Japanese candlesticks.
- A line chart connects closing prices only: great for the big picture, but it hides what happened inside each period.
- Bars and candlesticks show four prices per period: open, high, low and close.
- A candle has a body (open to close) and wicks (high and low); its colour tells you whether it closed above or below its open.
- One candle describes the past. It does not promise the future.
빠른 확인
3문제. 답을 고르면 이유를 볼 수 있어요.
1.What does a line chart show?
2.In a candlestick, what does the body show?
3.A stock opens at 100, trades between 98 and 106, and closes at 104. The candle is:
출처
이 강의의 모든 사실은 아래 출처로 뒷받침됩니다.
- 1.MetaTrader 5 Help — View and configure chartsCharts can be shown as bars, Japanese candlesticks or a line
- 2.CME Group Education — Chart types: candlestick, line, barLine chart shows closing prices; bars and candles show open, high, low and close; body and wick definitions
- 3.ASX — Shares course 11: Technical analysis (PDF)A line chart represents only one point per period; charts cannot predict the future with any certainty
교육 콘텐츠이며 투자 조언이 아닙니다. 위험 고지: 외환, CFD, 금, 가상자산 거래는 위험이 매우 높아 모든 사람에게 적합하지 않을 수 있으며, 투입한 금액보다 더 많이 잃을 수 있습니다. Souq Daily는 교육 플랫폼입니다. 이곳의 어떤 내용도 투자 조언, 추천 또는 권유가 아니며, 과거 성과가 미래 결과를 보장하지 않습니다.