سبق 1 از 123:553 حوالہ جات
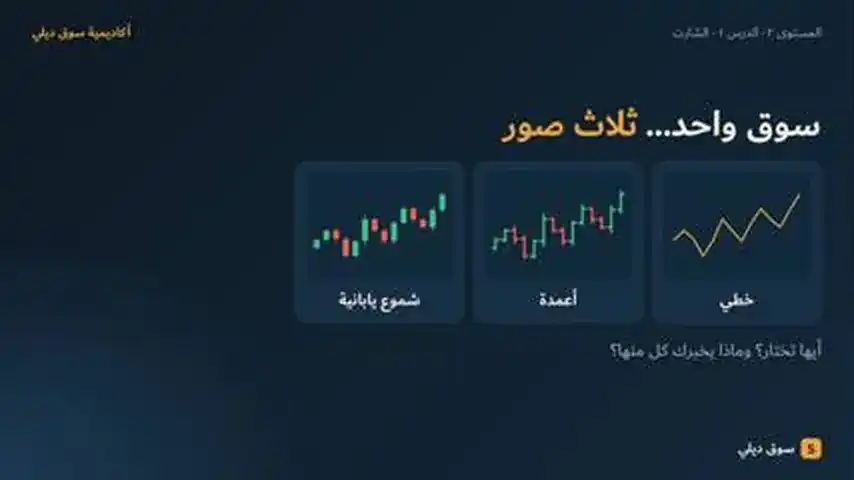
چارٹ: لائن، بار اور جاپانی کینڈل اسٹک
ریکارڈ ہو چکی، جلد شائع ہوگی
یہ تعلیمی مواد ہے، سرمایہ کاری کا مشورہ نہیں۔ نور بتاتی ہیں کہ مارکیٹ کیسے کام کرتی ہے۔ وہ کبھی نہیں بتاتیں کہ کیا خریدیں یا بیچیں۔
اس سبق کا مکمل اردو ترجمہ جلد آ رہا ہے۔ ابھی آپ انگریزی نسخہ پڑھ رہے ہیں۔
Technical analysis studies price movement itself, and the chart is its first tool. Platforms such as MetaTrader 5 show price as a line, bars or Japanese candlesticks.
- A line chart connects closing prices only: great for the big picture, but it hides what happened inside each period.
- Bars and candlesticks show four prices per period: open, high, low and close.
- A candle has a body (open to close) and wicks (high and low); its colour tells you whether it closed above or below its open.
- One candle describes the past. It does not promise the future.
فوری جانچ
تین سوال۔ جواب منتخب کریں اور وجہ دیکھیں۔
1.What does a line chart show?
2.In a candlestick, what does the body show?
3.A stock opens at 100, trades between 98 and 106, and closes at 104. The candle is:
حوالہ جات
اس سبق کی ہر بات نیچے دیے گئے حوالوں سے ثابت ہے۔
- 1.MetaTrader 5 Help — View and configure chartsCharts can be shown as bars, Japanese candlesticks or a line
- 2.CME Group Education — Chart types: candlestick, line, barLine chart shows closing prices; bars and candles show open, high, low and close; body and wick definitions
- 3.ASX — Shares course 11: Technical analysis (PDF)A line chart represents only one point per period; charts cannot predict the future with any certainty
یہ تعلیمی مواد ہے، سرمایہ کاری کا مشورہ نہیں۔ رسک کی وارننگ: فاریکس، CFD، سونے اور کرپٹو کی ٹریڈنگ میں بہت زیادہ خطرہ ہے اور یہ ہر کسی کے لیے موزوں نہیں ہو سکتی۔ آپ اپنی لگائی ہوئی رقم سے زیادہ کھو سکتے ہیں۔ Souq Daily ایک تعلیمی پلیٹ فارم ہے۔ یہاں کچھ بھی سرمایہ کاری کا مشورہ، سفارش یا پیشکش نہیں، اور ماضی کی کارکردگی مستقبل کے نتائج کی ضمانت نہیں۔