第 7 课 / 共 12 课4:033 出处
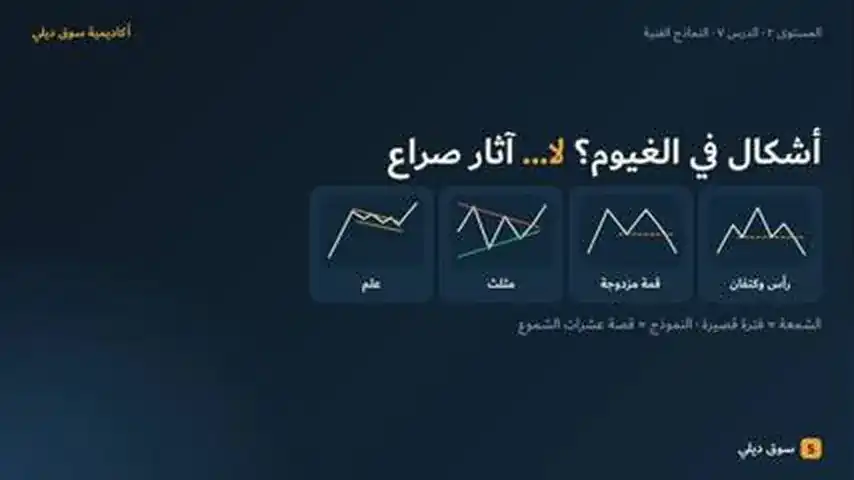
图表形态:头肩、双顶双底、三角形、旗形
已录制,即将发布
主讲:Nour阿拉伯语讲解,配有字幕。更多语言即将推出。
教育内容,不构成投资建议。Nour 讲解市场如何运作,从不告诉你该买什么或卖什么。
本课的完整中文翻译即将上线,你现在看到的是英文版。
Chart patterns tell the story of dozens of candles, built from support, resistance and trendlines.
- Reversal: double top/bottom (confirmed when price breaks the low/high between the two peaks/troughs) and head and shoulders (signal usually when price breaks the neckline).
- Continuation: flags and pennants — short, tight pauses usually seen mid-trend.
- Triangles compress price; ascending is generally bullish, descending generally bearish — “generally” matters.
- Wait for a close beyond the line; volume can add confirmation; measured targets are estimates; place stops where the pattern is invalidated. Patterns can fail.
快速自测
三道题。选一个答案,查看原因。
1.When is a double top usually confirmed?
2.Flags are typically seen:
3.Double top at 1.1200 with the low between peaks at 1.1100. A common measured estimate after the break is near:
出处
本课中的每个事实都有以下出处支撑。
- 1.CME Group Education — Technical patterns: reversalsHead and shoulders neckline break; double top confirmation; inverse H&S less common; patterns are only indications
- 2.CME Group Education — Trend and continuation patternsFlags, pennants, symmetrical/ascending/descending triangles; continuation patterns do not always signal continuation
- 3.ASX — Shares course 11: Technical analysis (PDF)Rising volume at a break regarded as further confirmation
教育内容,不构成投资建议。 风险提示:外汇、差价合约(CFD)、黄金和加密资产交易风险很高,未必适合所有人,你的亏损可能超过投入。Souq Daily 是教育平台,本站任何内容均不构成投资建议、推荐或要约,过往表现不代表未来结果。