12강 중 9강3:513 출처
모멘텀 지표: RSI와 MACD
녹화 완료, 곧 공개
진행: Nour아랍어 진행, 자막 제공. 다른 언어도 준비 중입니다.
교육 콘텐츠이며 투자 조언이 아닙니다. Nour는 시장의 원리를 설명할 뿐, 무엇을 사거나 팔라고 말하지 않습니다.
이 강의의 한국어 전체 번역은 곧 제공됩니다. 지금은 영어판을 보고 계십니다.
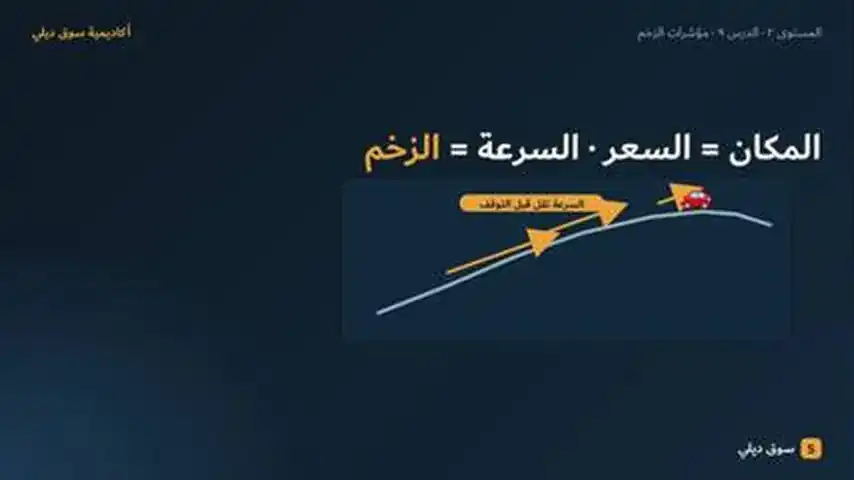
Momentum indicators measure the speed of price, which often slows before a turn.
- RSI ranges from 0 to 100; Wilder recommended 14 periods. Above 70 is generally read as overbought, below 30 as oversold — zones, not orders.
- MACD = 12-period EMA minus 26-period EMA, with a 9-period signal line. Crossovers and the zero line describe momentum.
- Divergence (price makes a higher high, RSI a lower high) may warn of a trend change — “may”, not “will”.
- Indicators can stay overbought for a long time in strong trends. Use them as an extra witness, not a judge.
빠른 확인
3문제. 답을 고르면 이유를 볼 수 있어요.
1.What period did Wilder recommend for RSI?
2.EMA(12) = 1.1120 and EMA(26) = 1.1100. The MACD line is:
3.RSI has been above 70 for weeks while price keeps rising. What does this mean?
출처
이 강의의 모든 사실은 아래 출처로 뒷받침됩니다.
- 1.MetaTrader 5 Help — Relative Strength IndexRSI ranges 0–100; Wilder recommended 14 periods; tops above 70 and bottoms below 30; divergence
- 2.MetaTrader 5 Help — MACDMACD = EMA(12) − EMA(26); 9-period signal line; crossover rule
- 3.CME Group Education — Oscillators: MACD, RSI, stochasticsAbove 70 overbought / 30 oversold; signals when MACD crosses signal line; divergence might indicate trend change; indicators can remain overbought/oversold in strong trends
교육 콘텐츠이며 투자 조언이 아닙니다. 위험 고지: 외환, CFD, 금, 가상자산 거래는 위험이 매우 높아 모든 사람에게 적합하지 않을 수 있으며, 투입한 금액보다 더 많이 잃을 수 있습니다. Souq Daily는 교육 플랫폼입니다. 이곳의 어떤 내용도 투자 조언, 추천 또는 권유가 아니며, 과거 성과가 미래 결과를 보장하지 않습니다.