Aula 1 de 123:553 Fontes
Gráficos: linha, barras e candles japoneses
Gravado. Publicação em breve
Conteúdo educativo, não é recomendação de investimento. A Nour explica como os mercados funcionam. Ela nunca diz o que comprar ou vender.
A tradução completa desta aula chega em breve. Você está lendo a versão em inglês.
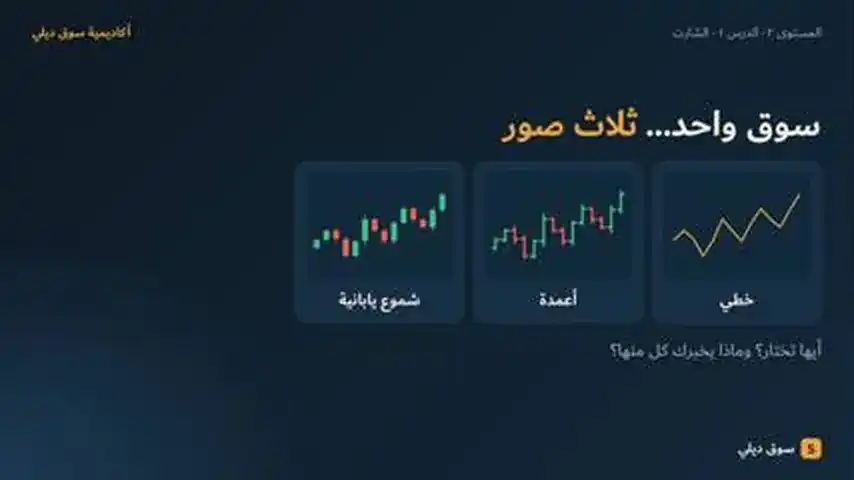
Technical analysis studies price movement itself, and the chart is its first tool. Platforms such as MetaTrader 5 show price as a line, bars or Japanese candlesticks.
- A line chart connects closing prices only: great for the big picture, but it hides what happened inside each period.
- Bars and candlesticks show four prices per period: open, high, low and close.
- A candle has a body (open to close) and wicks (high and low); its colour tells you whether it closed above or below its open.
- One candle describes the past. It does not promise the future.
Teste rápido
Três perguntas. Escolha uma resposta para ver o porquê.
1.What does a line chart show?
2.In a candlestick, what does the body show?
3.A stock opens at 100, trades between 98 and 106, and closes at 104. The candle is:
Fontes
Cada fato desta aula é sustentado pelas fontes abaixo.
- 1.MetaTrader 5 Help — View and configure chartsCharts can be shown as bars, Japanese candlesticks or a line
- 2.CME Group Education — Chart types: candlestick, line, barLine chart shows closing prices; bars and candles show open, high, low and close; body and wick definitions
- 3.ASX — Shares course 11: Technical analysis (PDF)A line chart represents only one point per period; charts cannot predict the future with any certainty
Conteúdo educativo, não é recomendação de investimento. Aviso de risco: operar forex, CFDs, ouro e cripto envolve alto risco e pode não ser adequado para todos. Você pode perder mais do que investiu. A Souq Daily é uma plataforma educacional. Nada aqui é recomendação de investimento, sugestão ou oferta, e resultados passados não garantem resultados futuros.